
The Small Business Deduction Index
How Expenses Scale With Revenue
Most small business owners know they should track deductible expenses, yet few have a clear sense of what their peers actually claim. This report draws on aggregated, anonymized data from the 1-800Accountant client base to demonstrate how deduction patterns shift as a business grows from pre-revenue to six figures and beyond. The goal is a practical benchmark for any sole proprietor, LLC owner, freelancer, or independent contractor who wants to know whether their expense profile looks normal, generous, or under-claimed.
The headline finding is simple: as revenue rises, both the share of business owners claiming a given deduction and the average dollar amount of that deduction tend to increase. The pattern is not uniform across all categories, and the exceptions are among the most useful signals in the data.
Key Highlights
Vehicle and home office are the two most widely claimed deductions, taken by 72% and 67% of small business owners, respectively.
Average deductions scale sharply with revenue. The typical advertising deduction increases more than 11 times between the smallest and largest revenue tiers in the data, while supplies increase by more than 8 times.
Home office adoption is remarkably stable across revenue levels (66% to 69%), suggesting it is a baseline deduction that most owners take regardless of business size.
Higher-revenue businesses are far more likely to track and claim travel, meals, and dedicated workspace rent, reflecting a shift from solo operations to client-facing or team-based work.
Pre-revenue and very small businesses tend to over-index on marketing and seminar startup-style expenses, while under-indexing on operational categories like office and vehicle costs.
How This Index Was Built
The data behind this report covers a sample of small business clients served by 1-800Accountant, segmented by gross revenue into four operational tiers: $1 to $25,000, $25,001 to $50,000, $50,001 to $100,000, and $100,000 and above. Two metrics are reported for each expense category:
The first is the percentage of clients in a revenue bracket who claim the deduction at all.
The second is the average dollar amount of the deduction among the clients who claim it.
Reading both together is critical: a category with a low claim rate but a high average can be just as meaningful as a high-adoption category with a smaller average.
The Most Common Small Business Deductions
Before looking at how deductions change with revenue, it helps to know which categories the typical small business owner commonly uses. This table ranks the ten most widely claimed deductions across the full client base, along with the average dollar amount among the business owners who take them.
Rank | Deduction | % of clients claiming | Average amount |
|---|---|---|---|
1 | Vehicle (mileage) | 72% | $6,367 |
2 | Home office | 67% | $11,115 |
3 | Dues and subscriptions | 55% | $2,942 |
4 | Supplies | 48% | $6,402 |
5 | Computer and internet | 44% | $1,376 |
6 | Auto expenses | 40% | $6,853 |
7 | Office expense | 38% | $1,548 |
8 | Telephone | 37% | $1,390 |
9 | Meals | 33% | $1,931 |
10 | Utilities | 29% | $2,915 |
Two patterns stand out. First, the vehicle deduction is most common, claimed by nearly three-quarters of small business owners. The IRS standard mileage rate makes this an unusually accessible deduction for owners who use their personal vehicles for business, including freelancers and independent contractors who might assume they have nothing to deduct. The IRS publishes the current rate each year and details the rules in its standard mileage rates guidance.
Second, average dollar amounts vary by an order of magnitude across categories. Home office, vehicle, supplies, and auto expenses routinely produce four- and five-figure deductions. That weight matters: a single overlooked deduction can mean thousands of dollars in extra tax liability, which can devastate cash-strapped operations.
How Deductions Scale With Revenue
The clearest signal in the data is that deductions do not stay flat as a business grows. Both the likelihood of claiming a deduction and the average amount tend to climb with revenue. This table shows the average deduction amount for each revenue bracket for every major category, sorted by the size of the change.
Deduction | % of all clients | $1K to $25K avg | $25K to $50K avg | $50K to $100K avg | $100K+ avg |
|---|---|---|---|---|---|
Vehicle (mileage) | 72% | $4,276 | $8,419 | $12,452 | $16,121 |
Home office | 67% | $10,264 | $13,295 | $12,867 | $14,178 |
Supplies | 48% | $2,912 | $5,213 | $7,877 | $24,109 |
Auto expenses | 40% | $3,856 | $4,576 | $16,858 | $10,652 |
Advertising | 27% | $1,303 | $1,214 | $2,449 | $14,684 |
Meals | 33% | $1,236 | $1,377 | $3,316 | $4,042 |
Travel | 23% | $2,676 | $2,859 | $5,718 | $8,623 |
Rent (workspace) | 22% | $10,669 | $12,746 | $12,406 | $15,918 |
Office expense | 38% | $1,199 | $1,078 | $2,221 | $3,074 |
Telephone | 37% | $967 | $1,217 | $3,190 | $1,806 |
Utilities | 29% | $2,280 | $2,717 | $3,753 | $4,457 |
Dues and subscriptions | 55% | $3,439 | $2,684 | $3,200 | $2,999 |
Computer and internet | 44% | $1,316 | $1,500 | $1,446 | $1,703 |
Liability insurance | 22% | $1,548 | $1,726 | $1,563 | $3,315 |
Reading down the table, a few storylines emerge. Vehicle and supplies expenses scale almost linearly with revenue, suggesting they are directly tied to the volume of work a business is doing. Advertising scales the most aggressively of any category, but only at the top end: average ad spend in the $100K+ tier is roughly 11 times that in the lowest revenue tier. That jump reflects a significant strategic shift, where established businesses move from word-of-mouth or organic growth to paid acquisition.
Home office, in contrast, is the most stable category. The percentage claiming it barely moves between revenue brackets (66% to 69%), and the average grows only about 40% between the smallest and largest tiers. This is a deduction tied to the physical setup of a workspace, not to how much revenue is flowing through it. Similarly, dues and subscriptions show flat or even slightly declining averages at higher revenue levels, likely because larger businesses consolidate software stacks rather than adding more tools.
Where the Biggest Growth Multiples Show Up
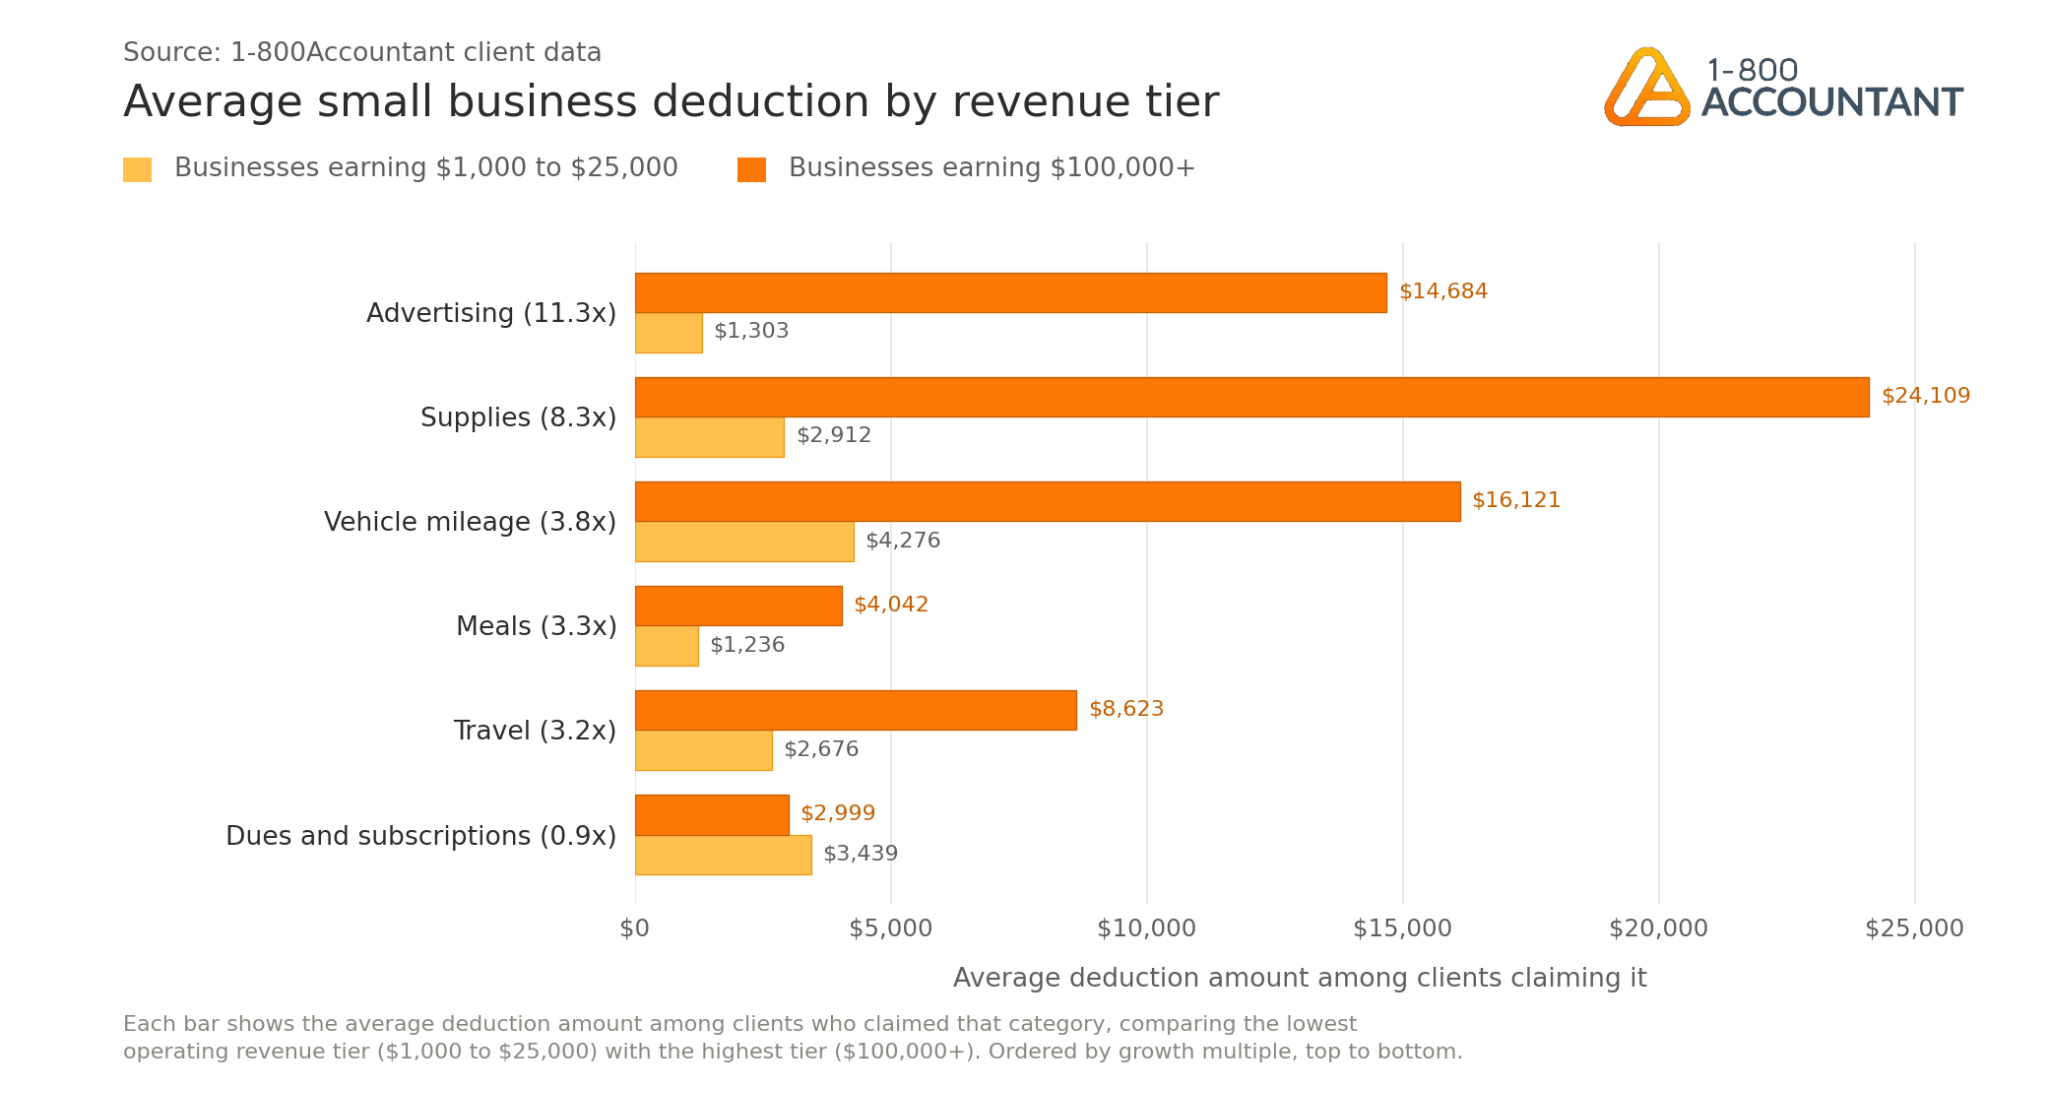
Ranking categories by how much the average deduction increases from the smallest revenue tier to the largest gives a clear read on which expenses tend to scale and which do not.
Deduction category | Avg at $1K to $25K | Avg at $100K+ | Growth multiple |
|---|---|---|---|
Advertising | $1,303 | $14,684 | 11.3x |
Supplies | $2,912 | $24,109 | 8.3x |
Vehicle (mileage) | $4,276 | $16,121 | 3.8x |
Meals | $1,236 | $4,042 | 3.3x |
Travel | $2,676 | $8,623 | 3.2x |
Office expense | $1,199 | $3,074 | 2.6x |
Auto expenses | $3,856 | $10,652 | 2.8x |
Utilities | $2,280 | $4,457 | 2.0x |
Liability insurance | $1,548 | $3,315 | 2.1x |
Telephone | $967 | $1,806 | 1.9x |
Rent (workspace) | $10,669 | $15,918 | 1.5x |
Home office | $10,264 | $14,178 | 1.4x |
Computer and internet | $1,316 | $1,703 | 1.3x |
Dues and subscriptions | $3,439 | $2,999 | 0.9x |
Categories at the top of this list, from advertising to travel, are where a growing business tends to spend meaningfully more in absolute dollars. Categories near the bottom, like home office, hit a kind of ceiling fairly early. A founder running a $30,000 side business and a founder running a $300,000 small business pay roughly the same for their laptop, their cloud storage, and the corner of the den that functions as their primary place of business.
This distinction matters at tax time. If a business is in a high-growth phase, the categories most likely to surprise an owner with larger-than-expected deductions are at the top of this table. Tracking them carefully throughout the year prevents a late-March rush to reconstruct ad spend or business mileage from memory. This last-minute practice is not recommended, as it increases the likelihood of IRS attention and disallowed deductions.
What This Means for Sole Proprietors and 1099 Contractors
These deduction patterns apply to small business owners across entity types, but they are especially consequential for sole proprietors and independent contractors who file Schedule C in April. For these filers, every legitimate deduction reduces both income tax and self-employment tax, which combined can take more than 30 cents of every dollar of net earnings. Under-claiming is expensive and does not always feel intuitive.
The data suggests two specific patterns worth flagging for 1099 earners and sole proprietors:
Vehicle is the single most under-claimed deduction. Just over 70% of businesses in the $1,000 to $25,000 revenue tier report a vehicle deduction, even though the vast majority of independent contractors use a personal car for client visits, deliveries, or errands. A business mileage log, when kept consistently, almost always pays for itself.
Home office adoption holds up well across all revenue tiers, but the average deduction stays modest in the lowest tier. That is often a function of incomplete tracking, rather than a smaller workspace. Capturing the full set of eligible costs, including utilities, internet, rent or mortgage interest, insurance, and repairs, tends to produce a noticeably larger deduction than the simplified method.
For a deeper dive on the deductions and forms used by independent earners, see the 1-800Accountant guide to 1099 contractor taxes.
The Pre-Revenue and Early-Stage Pattern
Businesses with zero or negative revenue, typically pre-launch or in their first months of operation, show a noticeably different profile from established businesses. They over-index on certain categories and under-index on others.
The marketing average for pre-revenue businesses is $8,250, almost six times the average for businesses in the $1,000 to $25,000 revenue tier ($1,430). This reflects upfront brand and launch spend that has not yet started producing income.
Repairs and maintenance averages are dramatically higher pre-revenue ($13,907) than in the lowest operating tier ($2,654). Owners building out a shop, studio, or workspace front-load that spend before the business launches.
Vehicle (mileage) averages drop to $2,695 pre-revenue, well below every other tier. The business is not yet operating, so the miles are not yet being driven.
The main takeaway for early-stage owners is that the deduction profile of a pre-revenue business is genuinely different from one that's already operating, and tax planning should account for that. Net operating losses generated in the early years can be carried forward and offset against income once the business becomes profitable, which is often a more valuable outcome than the year-one refund. The IRS provides guidance on net operating losses in Publication 536.
Where Small Businesses Leave Money on the Table
Cross-referencing adoption rates with what is broadly available to small business owners highlights common categories where the data suggest under-claiming.
Meals are claimed by only 33% of clients overall, even though the IRS allows a 50% deduction for most business meals, and 100% for certain employer-provided meals through specific years. For a business that regularly meets with clients, vendors, or remote teammates, this is often an under-tracked category.
Liability insurance is claimed by only 22% of clients, even though many service-based small businesses carry general liability or professional liability coverage. Coverage generally increases as the client's business becomes more established, as many do not get liability insurance when first launching.
Travel is claimed by 23% overall but jumps to nearly 40% at the $100K+ tier. Smaller businesses with legitimate business travel often forget to separate it from personal trips, losing the deduction entirely.
These deductions aren't obscure. They are categories that the IRS clearly allows and that the SBA encourages owners to track. The friction is almost always recordkeeping rather than eligibility. A clean monthly bookkeeping process, applied consistently, surfaces these categories before they get lost in the mix.
Building a Stronger Deduction Strategy
The data in this report points to one practical conclusion: small business owners who track expenses consistently throughout the year claim more deductions, in more categories, with larger average amounts than those who do not. The gap between a casual approach and a disciplined one tends to be measured in thousands of dollars annually, especially as revenue grows.
A year-round partner and strategic deduction selection will efficiently support your long-term growth strategy. Explore our small business bookkeeping and tax services today to see what dedicated accounting support looks like for your business in 2026.
This post is to be used for informational purposes only and does not constitute legal, business, or tax advice. Each person should consult his or her own attorney, business advisor, or tax advisor with respect to matters referenced in this post. 1‑800Accountant assumes no liability for actions taken in reliance upon the information contained herein.